CSWorks Tracing
Author: John Doe
Published: 2010-03-17 20:46:00
Last update: 2010-11-18 12:55:20
Tags: m2m
hmi
scada
web
csworks
troubleshooting
tracing
debugging
dbgview
trace listener
Slug: CSWorks-Tracing
When CSWorks is not working as expected the first thing to do is to see trace messages using a tool of your choice. This can be either some third-party tracing tool or a .NET trace listener.
Using tracing tools
I use DebugView by www.systeminternals.com. You can download the tool for free as part of their SysInternals Suite or as a standalone tool here.
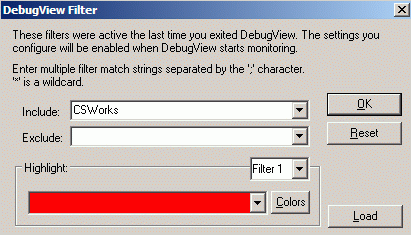
No installation needed, just run dbgview.exe. Please keep in mind that Vista, Server 2008 and Windows 7 users should run this tool with elevated privileges, otherwise it won't be able to catch trace messages. When prompted for a filter, enter "CSWorks":

Make sure you have checked "Capture Global Win32" and "Capture Events" items of "Capture" menu:

Now you are ready to capture CSWorks trace messages. In most cases, this is all you have to do in order to find a problem and take action. The following screenshot shows the case when LiveData Service is denied access to an OPC server:

- when you see this, you may want to run dcomcnfg utility and adjust OPC server permission or run service manager and change the account LiveData Service runs under.
Using .NET trace listeners
You can avoid using third-party software - just turn on .NET TextWriterTraceListener, it is a part of the .NET framework. The only thing you have to do is to modify config file of the service or web service you are troubleshooting as follows:
<system.diagnostics>
<trace autoflush="true" indentsize="2">
<listeners>
<remove name="Default" />
<add name="myListener" type="System.Diagnostics.TextWriterTraceListener" initializeData="C:\ProgramData\CSWorks\LiveDataServerLog.txt" />
</listeners>
</trace>
<switches>
<!-- Valid values are Error, Warning, Info, Verbose -->
<add name="GeneralTraceSwitch" value="Warning" />
</switches>
</system.diagnostics>
You can read more about .NET trace listeners at Microsoft web site.
Trace level
By default, all CSWorks server components send only error and warning messages, as displayed on the screenshot above. Sometimes this is not enough and you may want to see more details. Then you should increase tracing verbosity level of specific component(s).
For instance, if you need detailed tracing for LiveData Service, edit CSWorks.Server.LiveDataService.exe.config - set tracing level to "Info" or "Verbose":
<system.diagnostics>
<switches>
<add name="GeneralTraceSwitch" value="Verbose"/>
</switches>
</system.diagnostics>
After you restart LiveData Service, you will start getting much more output in DebugView window.
If you change tracing level for a web service, edit "GeneralTraceSwitch" value in correspondent web.config file. After you save updated web.config, changes will take effect immediately.


