I am always curious about my system performance. In this lab I will give CSWorks Alarming subsystem a hard time and see how it can handle it.
Environment
CSWorks 1.1.3700.0
Server: Intel Core 2 Quad Q6600 @ 2.40GHz, 3.25 GB RAM, Windows XP SP3
Client: Intel Core 2 Duo T5300 @ 1.73GHz (notebook), 2 GB RAM, Windows XP SP3
Network: Wireless 54 Mbps
Set-up
1. Install SQL Server 2008 Express on your server machine.
2. Create database "CSWorks"
3. Create AlarmEvents table - see "createCommand" parameter of <dbTarget name="Standard SQLServer DbTarget".../> in CSWorks.Server.AlarmService.exe.config.
4. Configure SQL Server data source in CSWorks.Server.AlarmService.exe.config:
<dbTargets activeDbTarget="Standard SQLServer DbTarget">
<dbTarget name="Standard SQLServer DbTarget" ... connectionString="Data Source=myserverbox\SQLEXPRESS; Initial Catalog=CSWorks;user id=sa;password=youknowit" ... maxEventAge="3600" .../>
Please note we tell CSWorks Alarm Service to keep alarm event records in the database for an hour so we can accumulate some amount of load data.
5. Restart CSWorks Alarm Service. Make sure events are now written to CSWorks database (run "select * from AlarmEvents" to confirm it).
6. Configure Silverlight web services URL for Alarm Demo application, so it can run from remote machine - make sure that ServiceReferences.ClientConfig in
C:\Program Files\CSWorks\Demo\Web\ClientBin\CSWorks.Client.AlarmDemo.xap
says
<endpoint address="http://myserverbox/CSWorksDemo/AlarmWebService/Service.asmx" ...>
For more details, see this post. Starting from version 1.4.3820.0, there is no need to do that, see this post for details.
7. Run Alarm Demo from a remote client and make sure it works properly.
8. Create a script that generates 3000 alarm descriptions in 10 alarm groups (download it here), run "cscript genalarms.js > alarms.txt", copy generated alarm groups to Alarms.xml, alarmGroups element. Here is an excerpt:
<alarmGroup id='00000000-AAAA-0000-0000-000000000000' description='Alarm group #0000'>
<alarms>
<alarm id='{00000000-0000-0000-0000-000000000000}' description='Total intake tank load, id 00000000' expression='tank1 + tank2 + tank3 + tank4' saveHistory='true' ... >
<thresholds>
<threshold ... message='Total intake tank load too high: {0:#,##0.00}, exceeds {1:#,##0.00}, id 00000000' ... />
...
<alarm id='{00000000-0000-0000-0000-000000090299}' description='Total intake tank load, id 00090299' expression='tank1 + tank2 + tank3 + tank4' saveHistory='true' ... >
<thresholds>
<threshold ... message='Total intake tank load too high: {0:#,##0.00}, exceeds {1:#,##0.00}, id 00090299' ... />
...
</thresholds>
</alarm>
</alarms>
</alarmGroup>
These generated alarms contain references to a couple of deployment variables: totalIntakeTankLoadMax and totalIntakeTankLoadMin. Add them to Alarms.xml as well:
<deploymentStates>
<deploymentState name="Normal" isActive="true">
<deploymentVariables>
...
<deploymentVariable name="totalIntakeTankLoadMax" type="Int32" value="380"/>
<deploymentVariable name="totalIntakeTankLoadMin" type="Int32" value="250"/>
</deploymentVariables>
</deploymentState>
<deploymentState name="Startup">
<deploymentVariables>
...
<deploymentVariable name="totalIntakeTankLoadMax" type="Int32" value="380"/>
<deploymentVariable name="totalIntakeTankLoadMin" type="Int32" value="250"/>
</deploymentVariables>
</deploymentState>
<deploymentState name="Shutdown">
<deploymentVariables>
...
<deploymentVariable name="totalIntakeTankLoadMax" type="Int32" value="380"/>
<deploymentVariable name="totalIntakeTankLoadMin" type="Int32" value="250"/>
</deploymentVariables>
</deploymentState>
</deploymentStates>
Save Alarms.xml and give CSWorks Alarm Service a couple of seconds to digest the changes (this piece doesn't scale of course, so only one server CPU is involved).
9. Add newly created alarm group ids to AlarmWebService web.config file:
<alarmTopology>
<alarmPartitions>
<alarmPartition ...>
<areas>
<!-- Test groups -->
<area id="{...}" name="Test groups">
<alarmGroups>
<alarmGroup alarmGroupId='00000000-AAAA-0000-0000-000000000000' description='Alarm group #0000'/>
...
<alarmGroup alarmGroupId='00000009-AAAA-0000-0000-000000000000' description='Alarm group #0009'/>
</alarmGroups>
</area>
...
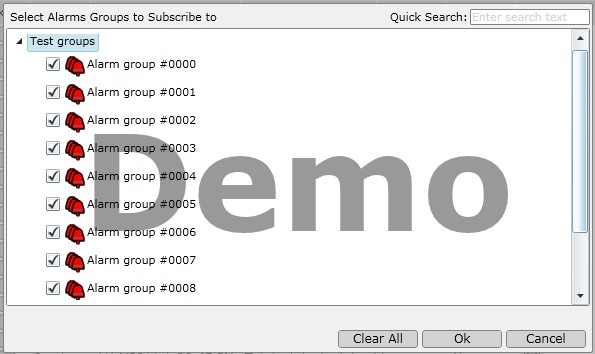
10. Subscribe to newly created alarm groups in Alarm Demo application, either using "Subscribe..." menu command:
Or you can do that in application XAML:
<alarm:AlarmSummary ... AlarmGroupIds="...;00000000-AAAA-0000-0000-000000000000;..." />
11. After running Alarm Demo on your client machine for a minute you will be able to observe 12000 new alarm events and considerable spikes in network usage: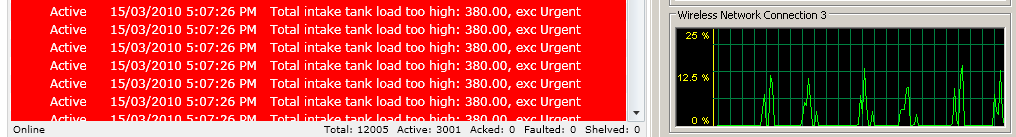
Let It Brew
Go grab a coffee and have a chat with your colleagues while CSWorks Alarm Service generates some alarm events.
Analyze This
Let's look at the alarm activity: System Monitor -> CSWorksAlarmService performance object -> Alarm Events per second: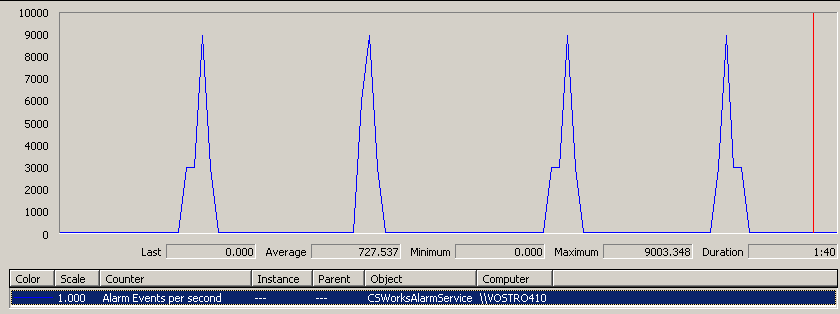
~730 alarm events per second on average with spikes up to 9000 events per second. This correlates with our setup, remember: an alarm becoming inactive is an event too, and we have 4 thresholds per alarm. So, each spike is basically a burst of 3000*6=18000 events generated in 5 seconds. Now let's look at the CPU usage on the server box: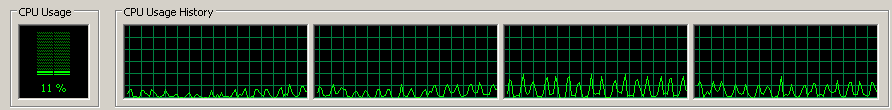
- not bad, the load is distributed properly. Let's make sure that all those events actually ended up in the database: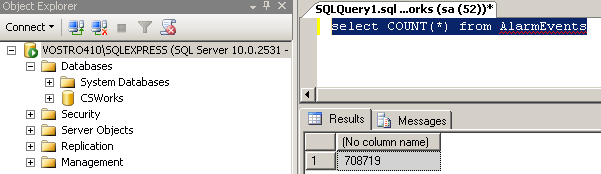
- good, those 700 000 events definitely did. Now back to the client.
With filtering turned off, the client seems to handle the spikes pretty well: Alarm Summary items are updated with 1-3 seconds delays. Things are getting worse if you apply a filter (say, show only active alarms): delay bumps up to 15 seconds. And of course, one of the processors on the client box is overloaded by filtering and data presentation activities. And it's not easy to scale them out: Silverlight dispatcher is single-threaded. Ok, there is some space for improvement on the client side.
And a word about network traffic for the inquiring minds. Fiddler tool tells all the truth and it ain't that ugly: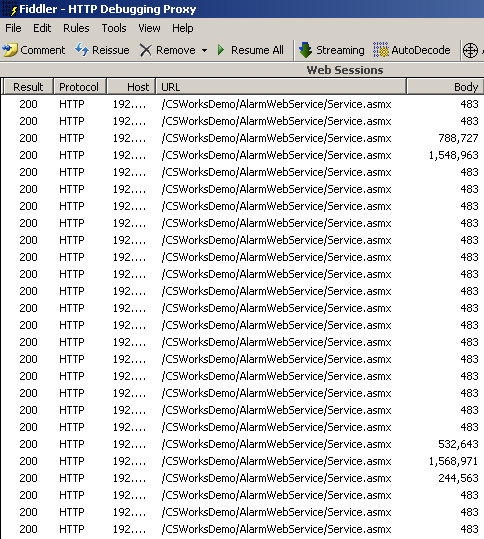
- each 2.3 MB per spike translates into ~130 bytes per event. Keep in mind that every event carries a unique text message. Not bad.
Back to Normal
Restore Alarms.xml - you have made a copy of the original file before inserting 3000 alarm descriptions, didn't you? Again, let CSWorks Alarm Service digest the changes and in a couple of seconds, alarm summary is almost clear, showing only a couple of events. The storm is over.
Summary
Server load is scaled properly, stable and predictable. Network traffic is predictable too, those performance freaks out there can gain some bandwidth using HTTP compression (yes, Silverlight supports it). Database performance doesn't seem to be an issue at all. The only bottleneck in this scenario is client CPU consumption when processing bursts of 18000 events. So, the recommendation is: if your operator needs to keep an eye on 18000 events fired in five seconds (which is very unikely), buy him/her a better client box.